
For any organization trying to build a culture of automation, making day-to-day operations transparent is the key. Data visualization and analytics are great ways to increase the visibility of your software automations to all stakeholders. Being able to monitor transactions in real time helps end-users coordinate work around the automation more effectively. For management, it might be more interesting to monitor the accumulated benefits over time. And most importantly, your robot workforce won’t mind you peering into their work, no matter how often.
In this article, we offer some examples of automation metrics that have appeared to be the most useful to the process owner and their team.
Monitor your robots’ heartbeat
The quickest way to get started with analytics is simply to show the numbers of transactions flowing through your processes, and from those, derive the rate of automation. We distinguish between the cases where work was completed successfully, and cases where human intervention was required, aka exception. Transactions that the robot can complete without errors increase the automation rate.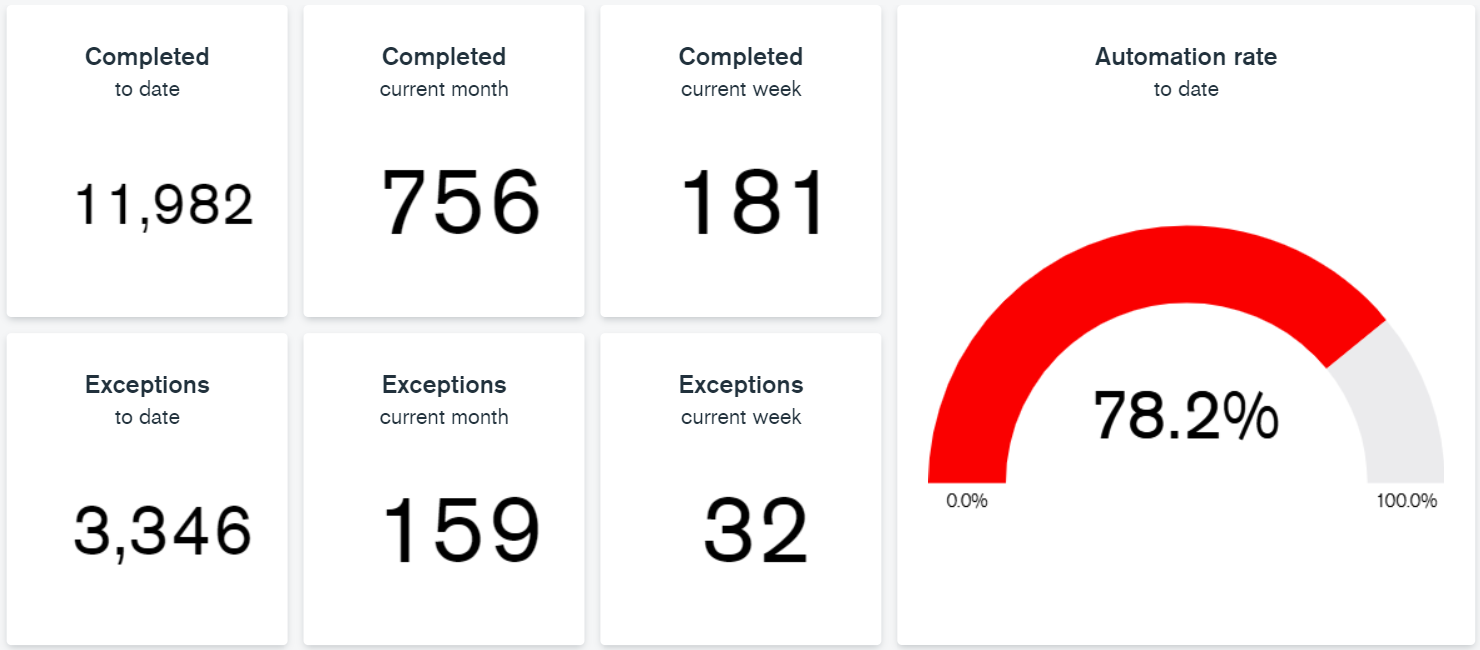
1 - Transaction volume metrics
(The above charts do not distinguish between exception types. In the following examples, business exceptions and technical systems failures are further differentiated with statuses of ‘expected_fail’ and ‘fail’, respectively.)
The process is run daily, and the number of transactions fluctuates:
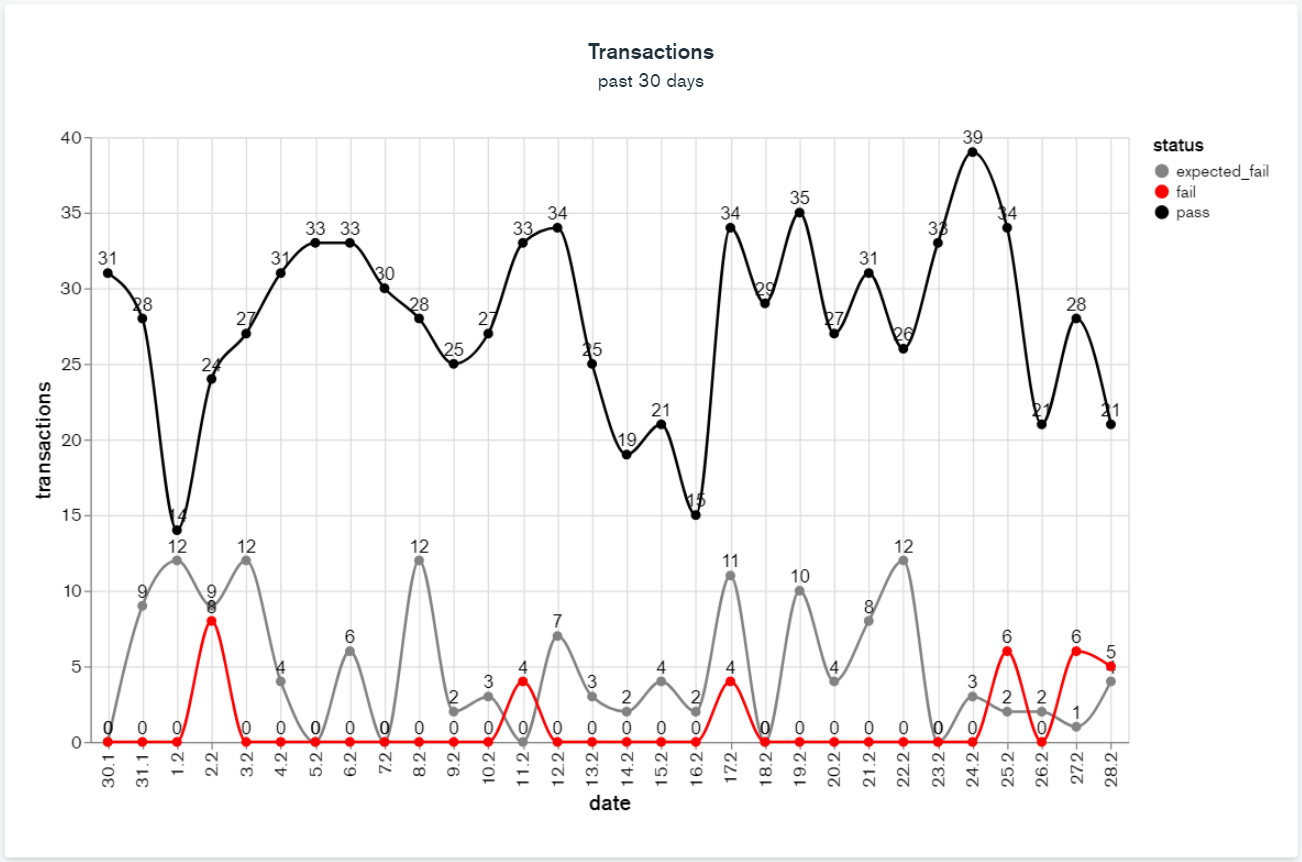
2 – Daily Transaction volumes over time
This kind of chart helps those working on the process in reconciling the number of transactions to the source systems, and thus ensuring the completion of daily work.
Taking this one step further, we can take a look at the monthly volumes of transactions. Our example process has been live since January 2020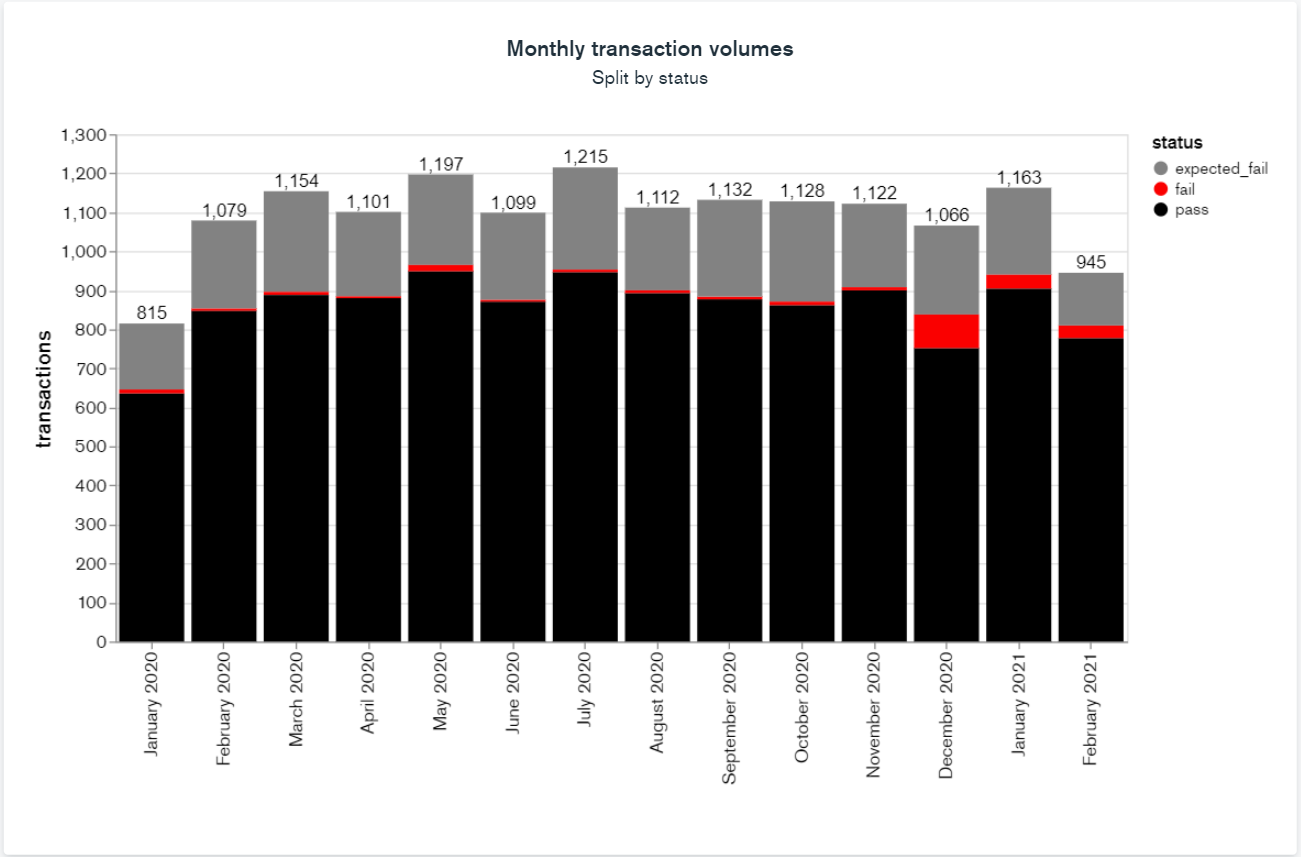
3 - Monthly transaction volumes from the robot’s lifetime
Gain insights by observing duration
Besides transaction volumes, the data can tell us how long it takes for the robot to do its work. Dividing the process into stages allows us to analyse the duration of each stage separately. Our example process consists of three stages.
- In the initial stage, new transactions are simply ingested from the source system into the database, so the duration is negligible.
- In the second stage, a workflow is performed in an ERP system, which takes about 60 seconds for the robot to complete. The workflow results in one PDF report file per transaction.
- Finally, in the third stage the PDF reports are uploaded to a file archival tool, taking 12 seconds on average.
-png.png) 4 - Measuring robot work duration
4 - Measuring robot work duration
Looking at the chart above, it seems that since December, the 2nd stage (denoted by the red bars) has taken on average 20 seconds longer to complete!
We can also see a dip of almost 10 percentage points in the automation rate.
-png-1.png)
5 - Automation rate over time
This adverse trend raises some concerns. Was there a change in the ERP? Did the data inputs inflate in some way? Further investigation would be required to get to the root cause of the issue.
How to get started?
I hope that the examples above have inspired you to think about how you can implement process analytics in conjunction with RPA. There are some great data visualization products on the market aimed at enterprise users, such as PowerBI and Tableau. If your organization is already using one of them, we support implementing the visualizations in your tool of choice.
On the other hand, if you don’t yet have an existing visualization capability, don’t worry. SKALER’s service includes a built-in data visualization platform that can be leveraged starting from your very first project. All the examples in this article were made with said tool. We include a basic set of metrics in every automation project we deliver. On top of them, we can add custom metrics that best fit your processes and needs.
About the writer:
Otto Ahonen
A consultant who thinks in code. A recent convert to the open source RPA movement.
https://www.linkedin.com/in/ottoa/